NTSB and Partners Help Air Crash Victims and Their Families

By Stephanie Matonek, NTSB Transportation Disaster Assistance Specialist

Today, the third International Day Commemorating Air Crash Victims and their Families, we join with survivors in remembering those they have lost.

Three years ago, the International Civil Aviation Organization (ICAO), in cooperation with the Air Crash Victims’ Families’ Federation International (ACVFFI), designated February 20 the International Day Commemorating Air Crash Victims and Their Families. This observance was established to ensure we never forget about the victims and their families, or the unimaginable journey these families faced in the aftermath of an aviation disaster.  

In the United States, the NTSB’s Family Assistance program was established in part by the tireless efforts of survivors and family members advocating for change after experiencing loss and suffering from aviation disasters in the 80s and early 90s. Today, the NTSB’s Transportation Disaster Assistance (TDA) team continues this important work to ensure survivors and families are provided information, resources, and support after a disaster, no matter what mode of transportation it occurs in. Yet the TDA team that is responsible for this program cannot do this work alone. Over the decades since the NTSB’s family assistance program began, the partnerships we have made with organizations and agencies from around the world and involved in providing family assistance after transportation disasters have become an integral part of our existence. In fact, our team today is continuously reminded how important and valuable these partnerships are to ensuring we meet the fundamental needs of survivors and families when tragedy strikes.

One partnership in particular has been vital to the NTSB’s family assistance program since its inception:  the American Red Cross. At the request of the TDA team, the Red Cross provides direct care and support to hundreds of families and survivors yearly. These efforts can be seen during NTSB public events, through direct requests by those TDA assists, and on-scene at accidents that NTSB investigates.

Today we remember each and every air crash victim we have lost, and their families. And we extend our appreciation to our family assistance partners that help us ensure that those who are affected most, survivors and families, get the care and support they need, no matter where or when a disaster occurs.

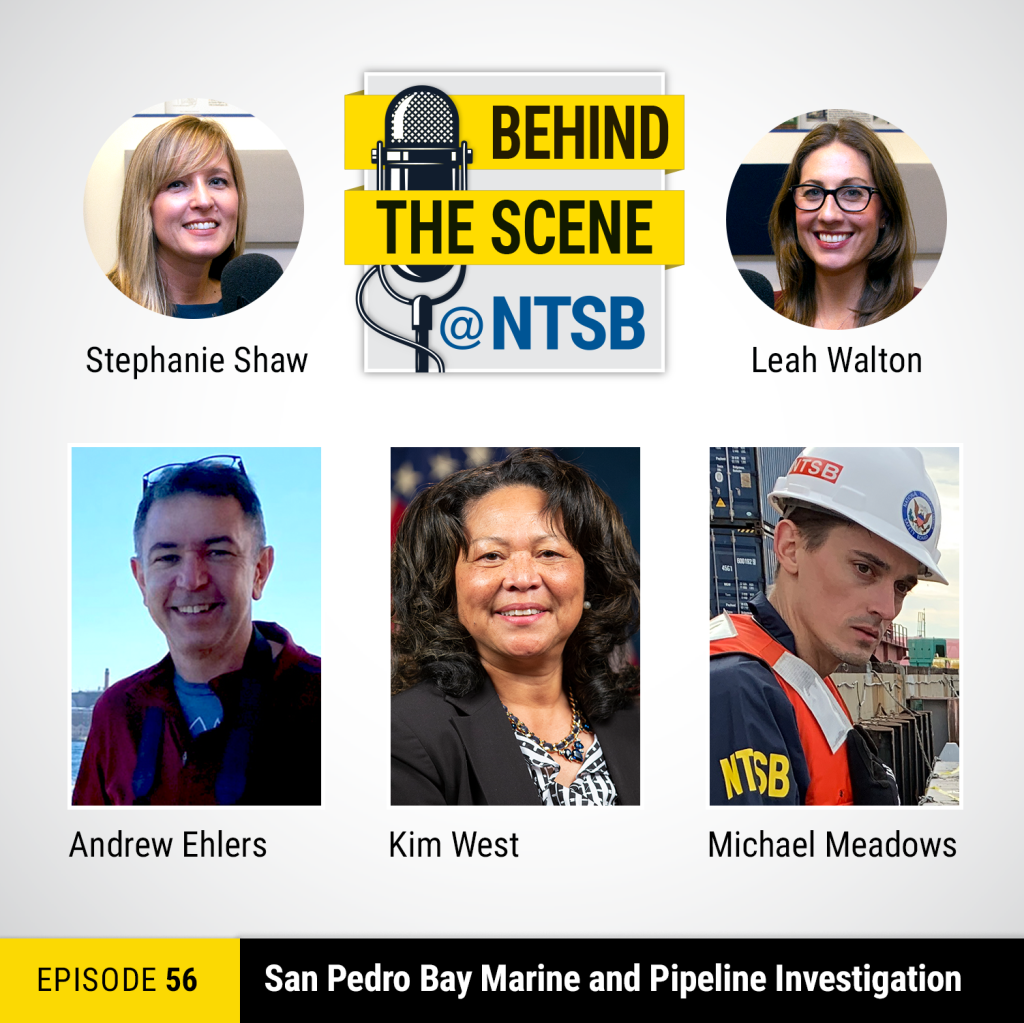
Episode 56: San Pedro Bay Marine and Pipeline Investigation

In this episode of Behind-the-Scene @NTSB, we talk with staff from the Office of Marine Safety, the Office of Railroad, Pipeline, and Hazardous Materials Investigations, and the Office of Research and Engineering, about the investigation of the 2021 Anchor Strike of Underwater Pipeline and Eventual Crude Oil Release in San Pedro Bay off the coast of Huntington Beach, CA.

For full details on this investigation, including a recording of the Board Meeting, visit our webpage.

Subscribe to the podcast on Apple PodcastsGoogle PlayStitcher, or your favorite podcast platform.

And find more ways to listen here: https://www.blubrry.com/behind_the_scene_ntsb/.

Accident Data Dashboards: Power to the User

“Yes, And” Approach Also Retains Familiar Excel Tables

By NTSB Safety Advocacy Team

Before reading any further, start exploring this dashboard. Addictive, right? If you care about aviation accidents, the NTSB’s dashboards get the statistics to you in an interactive format that always seems to have another layer to discover.

If you use the NTSB’s static accident spreadsheets in Excel, you can keep using them. But you’re getting less information, with less control, than is available to you through the agency’s data dashboards. Many users grab the same data regularly to populate legacy products, but if you want to see the data from many points of view with more control, check out the data dashboards.

In the new US Civil Aviation Accident Dashboard, for example, you can customize a range of years, see the data on a map, and filter by accident details for Part 121, Part 135, and general aviation (GA) flights. Familiar Excel tables, such as Accidents by Defining Events and Phases of Flight, are still available, but the dashboard lets you further customize the selected data dynamically by operation type, injury level, and state, delivering many more possible data views than the tables provide.

Screen capture of the NTSB US Civil Aviation Summary Dashboard

Historically, the NTSB Office of Research and Engineering’s Safety Research Division provided the annual census first as a printed book, and then as an annually updated set of Excel spreadsheets, and now, finally, as a dashboard. Additional GA data is also available in the new format. (And, because it was our first dashboard, the division created a video tutorial providing instructions for working with it.)

“We rolled out the GA dashboard for Oshkosh (EAA Airventure),” says Senior Aviation Accident Analyst Nathan Doble, who made the annual US Civil Aviation data available and interactive in dashboard form. “We recognized that this is a new capability for many of our users, so we wanted to provide training and solicit their feedback.”

Chief Data Scientist Loren Groff adds the team was conscientious about enhancing customer experience. “We took a ‘Yes And . . .’ approach with all of the dashboards. We’ll give you that familiar government document and we’ll also give you the new dashboard version with so much more control by the user.”

“Then there is the state-by-state, monthly breakdown,” Groff explains. “We had a congressional requirement to report accidents in Alaska monthly. The NTSB data analytics team thought, if we’re doing it for Alaska, why not do it for all the states?” (The monthly data are actually updated daily and organized by year and month.)

You can bring up a list of accidents covered in all of the dashboards, which in turn link to accident reports, and plot the accidents on a map. For GA accidents, you can see what types of findings and what recommendations the NTSB has issued in connection with accidents that meet the users’ filters.

Screen capture of the General Aviation (GA) Dashboard

Groff, Doble, and the Safety Research Division are taking the agency’s accident data from static tables to powerful interactive dashboards defined by the user, and in the process offering increased content and capabilities. Stay tuned as the NTSB’s dashboard capabilities continue to grow.