Category Archives: Research

Driving Change: Insights from the 2024 Lifesavers Conference

Anthony Lam, NTSB Transportation Safety Specialist, Office of Safety Recommendations and Communications

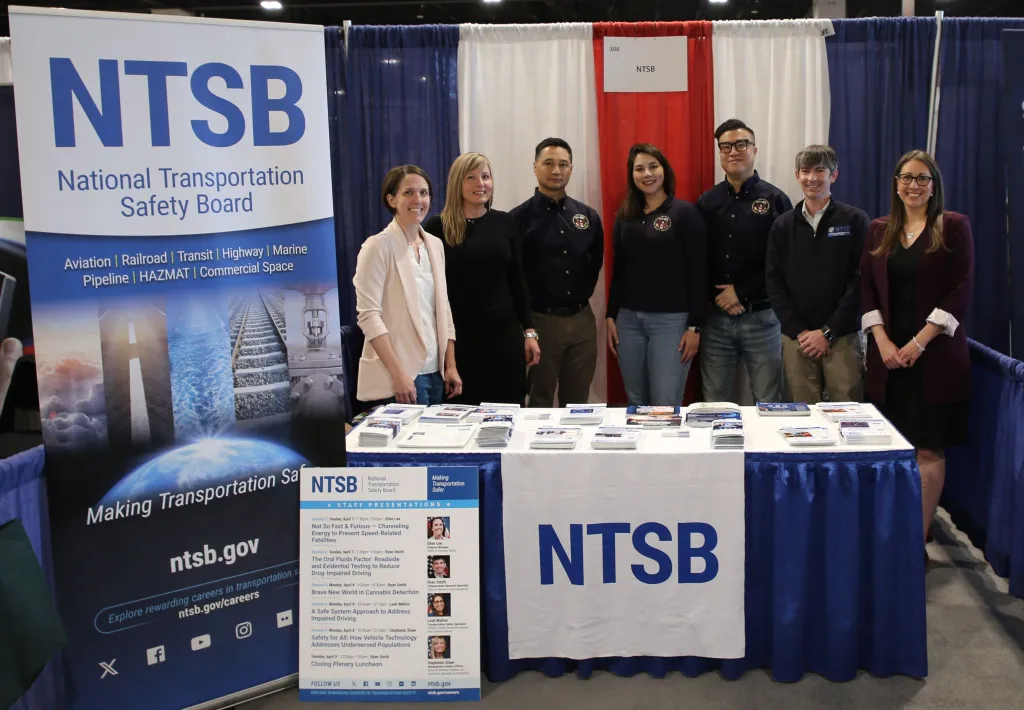
Attendees stepped into the world of road safety innovation and collaboration at last week’s Lifesavers Conference 2024 in Denver, Colorado. Each year, experts, advocates, and policymakers convene at Lifesavers to tackle pressing issues shaping the future of safer roadways. From combating impaired driving to ensuring equitable access to cutting-edge vehicle technology, NTSB staff presented and moderated a variety of workshops that offered invaluable insights and strategies for creating a safer tomorrow.

NTSB staff at 2024 Lifesavers Conference exhibit booth

NTSB Transportation Research Analyst Dr. Ryan Smith’s presentation, “The Oral Fluids Factor: Roadside & Evidential Testing to Reduce Drug-impaired Driving,” shed light on the rising interest in using oral fluid testing in roadside and evidential testing for drug impairment. With the landscape of cannabis legalization evolving and concerns about drugged driving escalating, the timing couldn’t be more crucial. Attendees gained insights into the nuances between preliminary and evidential testing, the mechanics of roadside testing, and the outcomes from states already implementing oral fluid testing. Discussions encompassed emerging challenges such as detecting novel drugs, ongoing research, and legal hurdles faced by states.

In 2022, we released a safety research report titled, Alcohol, Other Drug, and Multiple Drug Use Among Drivers, which found oral fluid is a valuable—but underused—biological specimen for detecting drug use by drivers. The report also recommended states modify their impaired-driving laws, if they have not already, to allow for oral fluid drug testing. Smith pointed this out in his presentation, adding, “It [oral fluid testing] can play a key role in supporting the enforcement of impaired-driving laws.”

Dr. Ryan Smith, Transportation Research Analyst, Office of Research and Engineering

Smith also organized and moderated the session, “Brave New World in Cannabis Detection,” which brought together leading-edge researchers in the field of cannabis detection. Cannabis impairment is a critical issue, and researchers discussed novel ways that cannabis use can be detected in drivers. In his opening remarks, Smith stated: “More than half of the US population now lives in a state where cannabis has been legalized. Recent NTSB research demonstrates the high prevalence of cannabis use among drivers, second in prevalence only to alcohol. Effective methods for detecting signs of cannabis impairment are critical for getting impaired drivers off our nation’s roadways.”

NTSB Office of Highway Safety Program Manager Ellen Lee gave a presentation on the dangers of speeding titled, “Not so Fast & Furious – Channeling Our Energy to Prevent Speed-related Fatalities,” which highlighted the urgent need to address speed-related fatalities through a comprehensive approach. Lee talked about the NTSB’s recent recommendations from our investigation of a crash in North Las Vegas, Nevada, where speeding and speeding recidivism were key.

Ellen Lee, Program Manager, Office of Highway Safety

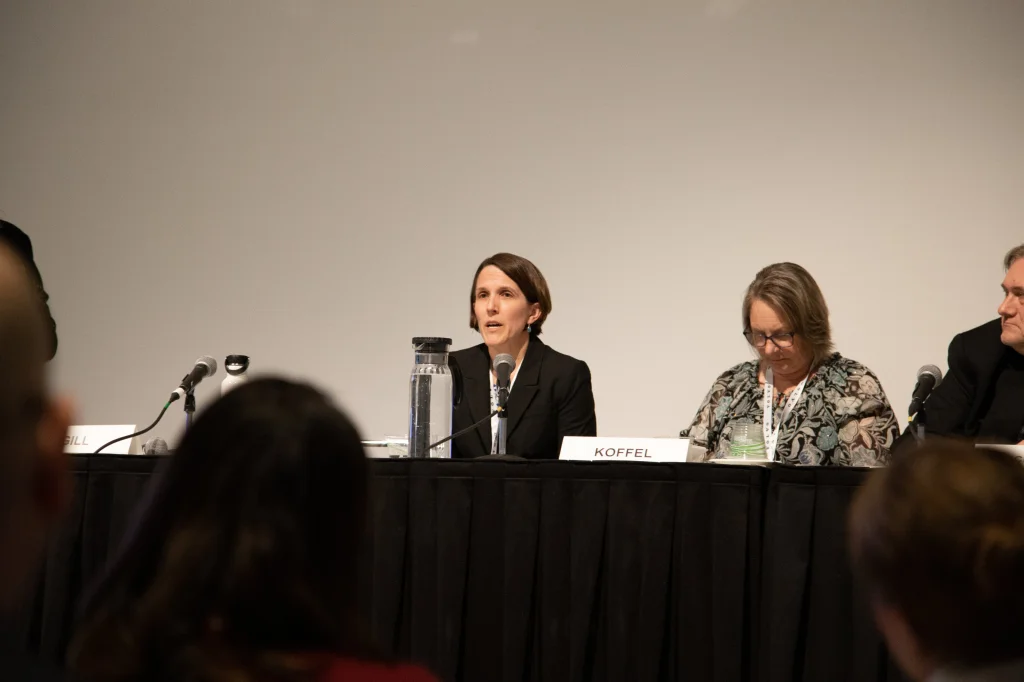
Lee emphasized our findings that the driver in the crash was impaired and had received seven recent speeding offenses in the 5 years before the crash. “Despite repeated law enforcement actions, the driver’s record was inaccurate (showing only one speeding violation) and local courts treated this driver as a new offender for each violation,” Lee said.

Drawing from NTSB crash investigations and real-world examples, attendees learned about effective countermeasures and community engagement strategies. From leveraging data insights to advocating for vehicle safety technologies and infrastructure enhancements, the workshop underscored the importance of collaboration to curb excessive speed and protect lives on the road.

NTSB Safety Advocate Leah Walton moderated a thought-provoking discussion in her session, “A Safe System Approach to Address Impaired Driving” exploring where and how impaired driving fits into the five pillars of the Safe System Approach. Walton and her panel explored the multifaceted challenges posed by impaired driving, particularly concerning polysubstance impairment. Attendees gained a deeper understanding of the prevalence and risks associated with this behavior, along with potential policy interventions and enforcement strategies.

Leah Walton, Safety Advocate, Office of Safety Recommendations and Communications

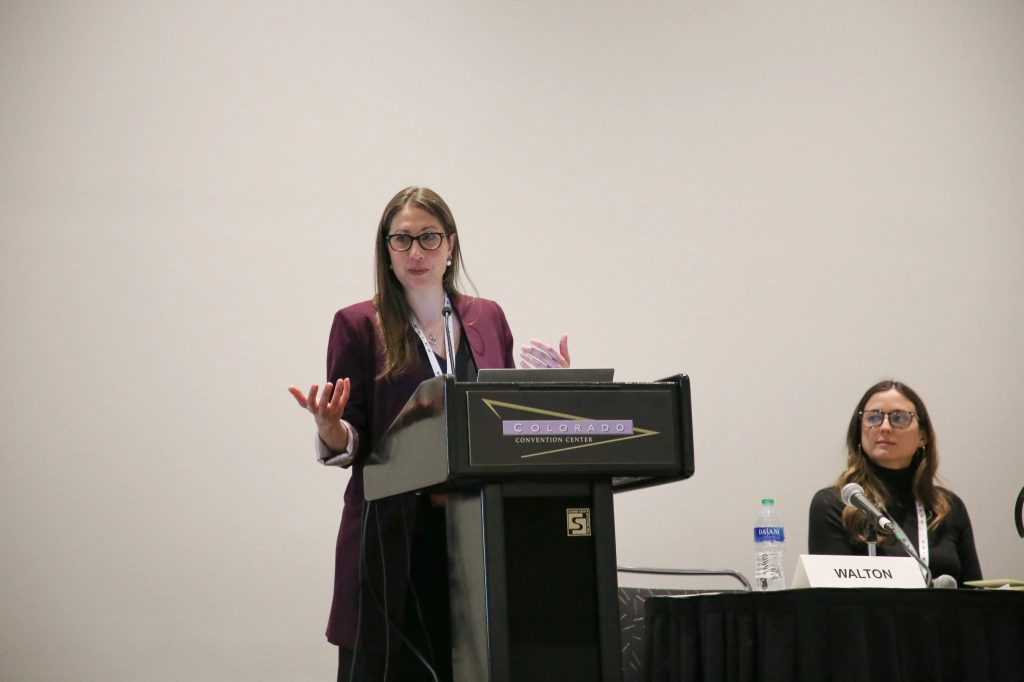
In Walton’s opening remarks, she emphasized, “We cannot have a safe system while impaired driving is killing over 13,000 people a year. To achieve zero fatalities, we must expand our view of impaired-driving prevention through the Safe System lens.” With an emphasis on partnership-building at both the state and national levels, the workshop provided a roadmap for stakeholders to tackle impaired driving head-on and enhance road safety.

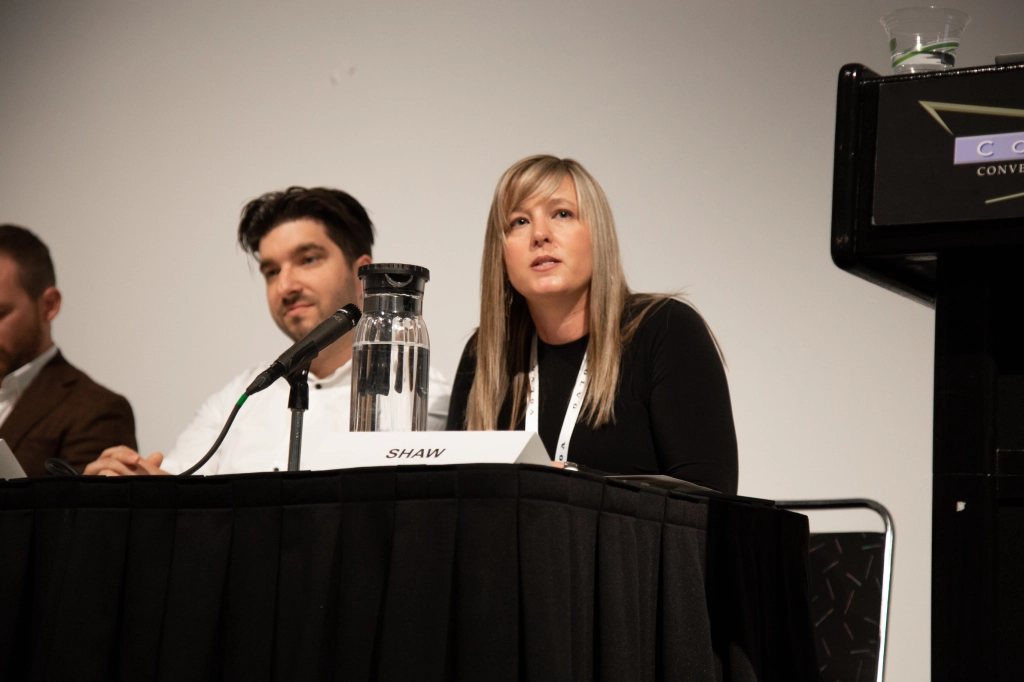
Stephanie Shaw, NTSB Management Analysis Officer, moderated the session, “Safety for All: How Vehicle Technology Addresses Underserved Populations.” Exploring design considerations, benefits, and challenges, attendees learned ways to extend these advancements to underserved populations. Shaw emphasized the importance of building a system that guarantees safe transportation for all who use it, regardless of socioeconomic status or mode of travel, whether it be personal vehicle, bike, walking, rolling, hailing a rideshare or an autonomous shuttle service, or taking public transportation. This sentiment encapsulated the overarching theme of inclusivity and accessibility discussed throughout the workshop.

Stephanie Shaw, Management Analysis Officer, Office of Railroad, Pipeline, and Hazardous Materials Investigations

The Lifesavers Conference serves as a catalyst for meaningful dialogue and collaboration in advancing road safety initiatives. By harnessing innovation, data-driven approaches, and community engagement, attendees are empowered to drive tangible change and create safer roads for everyone. We hope to continue these important dialogues at next year’s Lifesavers Conference in Long Beach, California!

Accident Data Dashboards: Power to the User

“Yes, And” Approach Also Retains Familiar Excel Tables

By NTSB Safety Advocacy Team

Before reading any further, start exploring this dashboard. Addictive, right? If you care about aviation accidents, the NTSB’s dashboards get the statistics to you in an interactive format that always seems to have another layer to discover.

If you use the NTSB’s static accident spreadsheets in Excel, you can keep using them. But you’re getting less information, with less control, than is available to you through the agency’s data dashboards. Many users grab the same data regularly to populate legacy products, but if you want to see the data from many points of view with more control, check out the data dashboards.

In the new US Civil Aviation Accident Dashboard, for example, you can customize a range of years, see the data on a map, and filter by accident details for Part 121, Part 135, and general aviation (GA) flights. Familiar Excel tables, such as Accidents by Defining Events and Phases of Flight, are still available, but the dashboard lets you further customize the selected data dynamically by operation type, injury level, and state, delivering many more possible data views than the tables provide.

Screen capture of the NTSB US Civil Aviation Summary Dashboard

Historically, the NTSB Office of Research and Engineering’s Safety Research Division provided the annual census first as a printed book, and then as an annually updated set of Excel spreadsheets, and now, finally, as a dashboard. Additional GA data is also available in the new format. (And, because it was our first dashboard, the division created a video tutorial providing instructions for working with it.)

“We rolled out the GA dashboard for Oshkosh (EAA Airventure),” says Senior Aviation Accident Analyst Nathan Doble, who made the annual US Civil Aviation data available and interactive in dashboard form. “We recognized that this is a new capability for many of our users, so we wanted to provide training and solicit their feedback.”

Chief Data Scientist Loren Groff adds the team was conscientious about enhancing customer experience. “We took a ‘Yes And . . .’ approach with all of the dashboards. We’ll give you that familiar government document and we’ll also give you the new dashboard version with so much more control by the user.”

“Then there is the state-by-state, monthly breakdown,” Groff explains. “We had a congressional requirement to report accidents in Alaska monthly. The NTSB data analytics team thought, if we’re doing it for Alaska, why not do it for all the states?” (The monthly data are actually updated daily and organized by year and month.)

You can bring up a list of accidents covered in all of the dashboards, which in turn link to accident reports, and plot the accidents on a map. For GA accidents, you can see what types of findings and what recommendations the NTSB has issued in connection with accidents that meet the users’ filters.

Screen capture of the General Aviation (GA) Dashboard

Groff, Doble, and the Safety Research Division are taking the agency’s accident data from static tables to powerful interactive dashboards defined by the user, and in the process offering increased content and capabilities. Stay tuned as the NTSB’s dashboard capabilities continue to grow.

Inside the NTSB’s Vehicle Recorder Lab

By Bryan Delaney, NTSB Safety Advocate
NTSB recorder specialist listens to and transcribes audio from a Cockpit Voice Recorder (CVR) in the CVR Listening Room.

If you watch the news coverage of a plane crash, you will very likely see investigators wearing the iconic blue jacket with “NTSB” written in bright yellow on the back. On scene, these investigators evaluate the wreckage and locate the flight recorders or “black boxes,” which contain essential information about the accident. Investigators transport the recovered flight recorders, the cockpit voice recorder (CVR) and the flight data recorder (FDR), to the NTSB headquarters in Washington, DC, where engineers use state-of-the-art technology and equipment within our Vehicle Recorder Lab to review the device’s content.

Throughout the year, the Vehicle Recorder Lab receives on average more than 400 electronic devices to examine. The experts within this lab play an important role in determining the probable cause of accidents in all modes of transportation. Most of the devices the Vehicle Recorder Lab receives are not CVRs and FDRs, which are designed to survive and accident, but other electronic devices that are no longer functioning and often require use of our Chip Recovery Lab.

Few get the opportunity to go inside our Vehicle Recorder Lab, see the technology we use, or meet the people behind the scenes whose electronic forensics skills help determine the probable cause of accidents. Let’s take a virtual look inside the lab.

A flight data recorder inserted into the Data Extraction Rack.

Arrival to the “Dirty Room”

Once a recorder arrives at NTSB headquarters, engineers take it to the lab’s “Dirty Room,” so called because of the condition of many of the electronic devices that arrive at the lab (damaged and usually covered with debris). First, the condition of the evidence as it arrived in the lab is documented and photographed. Engineers then perform any mechanical work needed to access the internal components of a damaged device. This can involve using cutting wheels, shears, and even hammers and pry bars. The devices are disassembled then transferred to other rooms and labs that have more specialized equipment to conduct closer inspections.

Engineer evaluates an Electronic Flight Information System (EFIS) from a recent crash investigation in the dirty room.

Microelectronics Lab

In the Microelectronics Lab, engineers inspect the electronic devices to determine if they contain information that can be downloaded and analyzed, if they require further detailed repair and recovery, or if they are damaged beyond recovery. Sometimes devices arrive relatively undamaged and can be downloaded using a manufacturer’s standard procedure, but often the devices are severely damaged by fire, impact, and/or liquid immersion and are no longer functional. In the Microelectronics Lab, engineers can use methods that include working down to the individual chip level to extract data while minimizing the possibility of data loss.

An active workstation within the Microelectronics Lab used to test
and probe electronic devices.

Visual Inspection Microscopes

An initial visual inspection is performed using digital and optical microscopes. The condition of the integrated circuits and other essential electronic components inside each device are evaluated and documented. Engineers identify areas of concern on circuit boards and electronic components such as broken connections, cracked components, or signs of corrosion. Once engineers ensure any damage to the memory chips have been repaired, a transplant of the memory chip can be conducted to a working device, or in some cases, the memory chip can be read directly.

X-Ray & CT Scanner

An x-ray taken from the lab’s x-ray scanner. Here, a microSD card from a device involved in an accident is examined for potential damage.

If engineers identify any concerns during the visual examination, they will transfer the memory device to the X-ray scanner to identify any potential internal issues on the memory devices. Under certain circumstances, a computed tomography (CT) scanner is also used to construct a 3D view of the component for further inspection. Once reviewed, engineers use the NTSB’s vast array of chip recovery tools to collect data.

Engineer uses equipment at a work station in the Microelectronics Lab.

FDR Laboratory

Once engineers have completed the initial inspection and documentation of the recorders, they bring the device to the FDR lab to process the raw recording into a format that can be used to help understand the circumstances of an accident.

A shelf unit housing nearly every known type
of flight data recorder.
These surrogate recorders are known as “Golden Chassis”.

Golden Chassis

A pristine example of nearly every FDR model ever used in modern aircraft can be found in the lab. These “surrogates” are used as a resource and reference when extracting data from heavily damaged recorders. These reference models are referred to in the accident investigation community as “Golden Chassis.” Engineers transfer the physical memory device from the damaged recorder to the golden chassis to facilitate data downloads.

Data Extraction Rack

The data extraction rack powers undamaged or repaired flight recorders and serves as a method to interface with the manufacturer’s software to download data. Each FDR will contain at least 25 hours of parametric data and each CVR will contain 2 hours of cockpit audio for investigators to review and use to help determine what might have happened during a crash.

FDR Recovery

Once an FDR is downloaded, engineers process the raw and extracted data—such as altitude, airspeed, and heading—to engineering data. Engineers then validate and

plot the data, showing a visual representation of the parameters recorded. This can be time consuming as newer aircraft frequently record hundreds, if not over a thousand, parameters. Technical specialists that are parties to the investigation (designated organizations or companies that are invited to assist the NTSB investigation) may assist NTSB recorder lab engineers at this stage.

Engineer inserts surrogate flight data recorder into the Data Extraction Rack.

CVR Recovery

The lab has listening rooms to allow investigators and select party members to review the cockpit audio recordings. The recorder specialist and any party members on the CVR audio group review the entire recording and transcribe the pertinent portions of the recording (or the entire recording). By federal law, the original recording is never released by the NTSB and party members participating in the group sign non-disclosure agreements. The CVR audio group produces a transcript of summary of the recording and other investigators will typically work from the transcript or summary.

A recorder specialist reviews recorder audio and transcribes pertinent content in
the CVR Listening Room.

In Conclusion

Extracting information from a new or damaged electronic recording device is often an arduous process, requiring superior technical and analytical skills. NTSB Recorder Lab engineers recognize the importance and gravity of their work and strive to provide the most accurate information for investigations. When we know what caused an accident, we can issue recommendations to those who can affect the change needed to make sure a similar accident doesn’t occur again. Retrieving the important recorded information from vehicles involved in a crash allows us to pinpoint issues and to make sure we’re addressing the right safety concerns, to make the best recommendations to improve transportation safety for everyone.

For more information, visit our Office of Research and Engineering page.

A previously released podcast episode featuring staff from the Vehicle Recorders lab is available here.